Reports & exports
Read back your year — profitability, rate realization, earnings and withholding, union funds, per-production breakdowns, penalty compliance, and PDF documents — all from the Reports hub.
The Reports page is where you read your numbers back. It brings everything you look at after the work is done — analytics, profitability, rate realization, year-to-date earnings and withholding, per-production breakdowns, union funds, penalty compliance, and formatted PDF documents — into one place.
Reports never change your data. Everything here is priced from the timesheets, income, expenses, and contracts you've already recorded. If a number looks off, the fix is upstream (edit the week, the income entry, or the contract) — the report will follow.
The tabs, grouped by the question
The tab bar is in three groups.
Money
| Tab | What it answers |
|---|---|
| Overview | The big picture — headline numbers, income by client, premium mix, forecast, per-production table. |
| Profitability | Which productions actually make money — profit margin, risk factors, health scoring, and rate-adjustment recommendations. |
| Worth it? | Every engagement on one denominator: wage dollars ÷ hours actually worked. A $950 day on a 14-hour call can be worth less per hour than a $425 performance; this is the tab that says so. |
| Rate realization | Booked rate vs. the effective $/hr you actually earned, per contract — rate erosion on one side, overtime lift on the other. |
| Negotiation | Pick a show and build a defensible ask from engine-priced work and source-backed terms. |
| Payers & ageing | Who owes you, who pays late, and a reliability read on each counterparty. |
| Forward book | Booked income ahead of you, over a 13-, 26-, or 52-week horizon. |
| Earnings | Your year's money: total gross, taxable vs. reimbursement, W-2/1099 split, and an estimated withholding breakdown. |
Union & compliance
| Tab | What it answers |
|---|---|
| Union & funds | Earnings and real fund contributions rolled up by Union Local and by fund — the analytics sibling of the quarterly filing. |
| Penalties | 7th-day, meal, and turnaround penalty analyses, with a date-range summary. |
Production & export
| Tab | What it answers |
|---|---|
| Production | A deep, per-production read-back — hours, overtime, per-phase/contract/tier breakdowns, benefits eligibility, and exports. |
| PDF Export | Server-rendered PDF documents (Annual Earnings, Project Summary, Expense Report). |
Honest empties, everywhere
These panels refuse to fabricate. A production with no revenue is dropped rather than plotted at
zero. An engagement with no call/out times reads "hours not recorded" rather than being given
an invented denominator. A figure that cannot be computed reads Unavailable, not $0.
Deep links remember your tab
The URL updates as you move between tabs, so ?tab=production&projectId=… links straight to a
specific production's report. Bookmark or share the link and it opens exactly where you left off.
Overview: the big picture
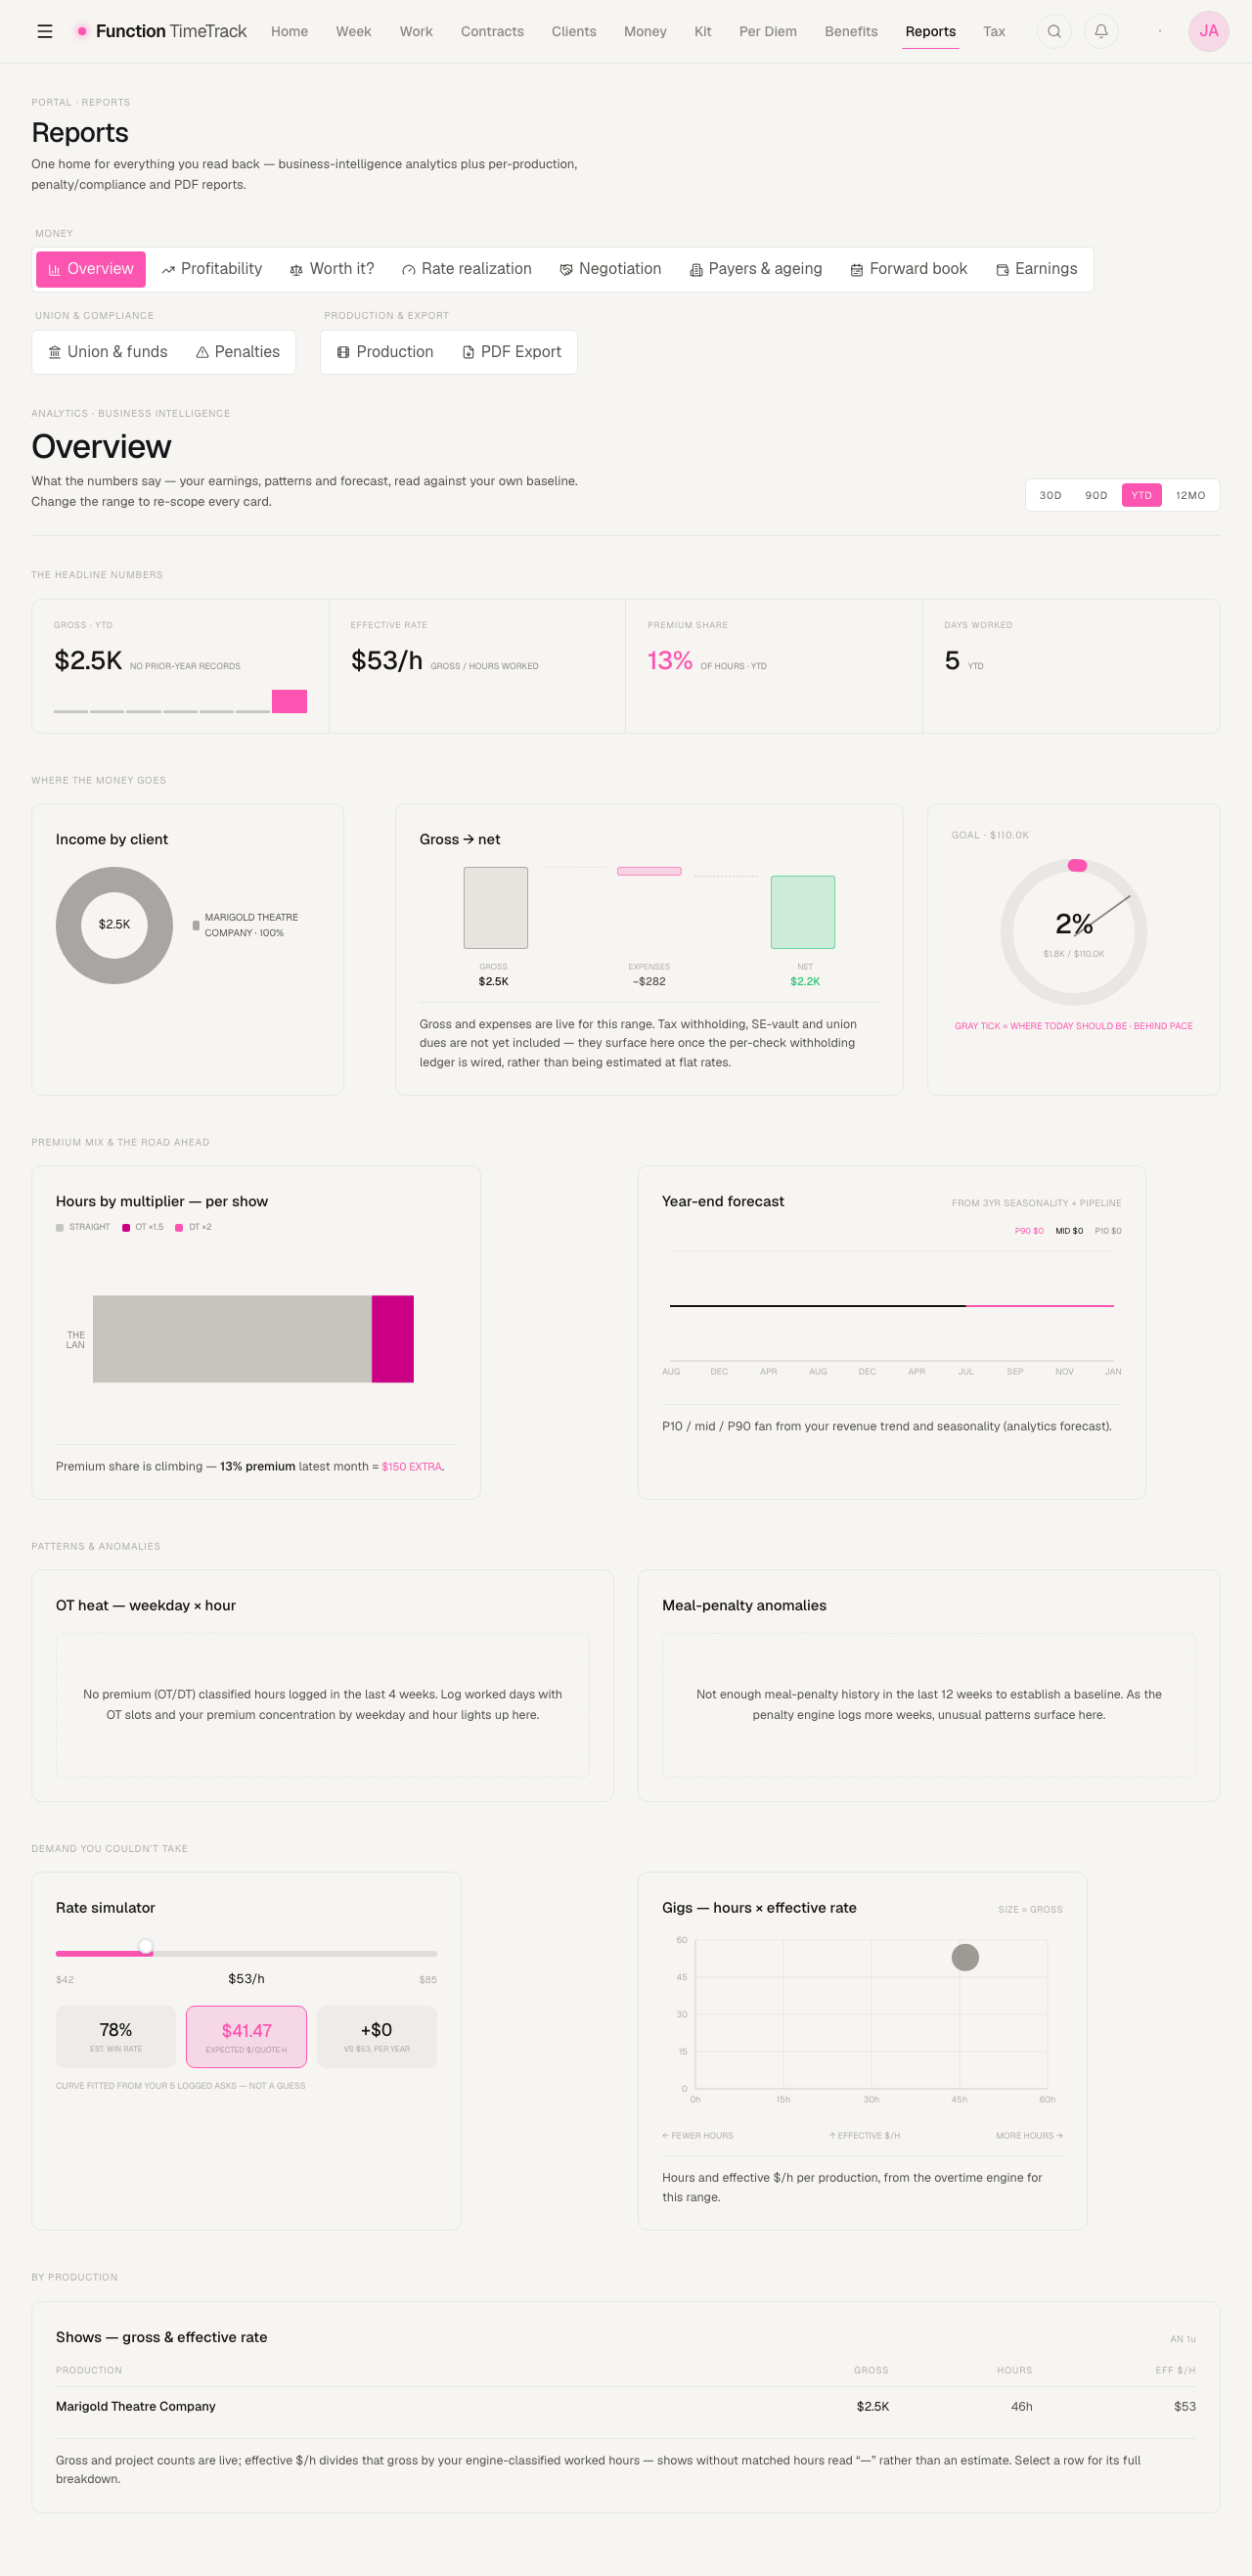
The Overview tab is your analytics dashboard. Open it and you'll see a strip of headline numbers followed by a series of cards.
Change the range to re-scope everything
In the top-right corner is a time-range toggle. Switching it (for example, from year-to-date to a quarter) re-scopes every card on the page at once — the headline numbers, the charts, and the forecast all update together.
The toggle offers 30D, 90D, YTD and 12MO.
What the cards tell you
- The headline numbers — gross, growth versus your own baseline, effective rate, and days worked.
- Where the money goes — income by client, a gross-to-kept waterfall, and a goal ring showing your pace against an annual target.
- Premium mix & the road ahead — your straight/overtime/doubletime hours by production, plus a year-end forecast fan.
- By production — a table of your shows with sparklines. Click any row to open a per-show drill-down with its gross, effective rate, and share of the total.
If a row is named after your client rather than your show
Income-by-client and the by-production table both group on a production's client field. Where that field is blank — even on a show properly linked to a client record — the money lands under "Unattributed (no client on project)"; where it is filled, the by-production table can end up printing the client's name in a column headed Production. The "Hours by multiplier — per show" card above uses the show's own name, so the same work can appear under two names on one page. Set the client on the production and the grouping is at least consistent.
Estimates are labelled honestly
Some figures — the tax, vault, and dues legs of the gross-to-kept waterfall — are estimated at flat rates and are footnoted as such. A few cards (the weekday-by-hour overtime heat map, meal-penalty anomalies) show an honest "not enough data yet" message rather than inventing sample numbers. As you log more weeks, they fill in.
If the Overview looks empty
If you haven't logged worked days or posted an invoice in the selected range, the tab shows a prompt to Log time or Create an invoice instead of a wall of zeros. Log some time (or widen the range) and the whole surface comes alive.
Earnings: your year in money
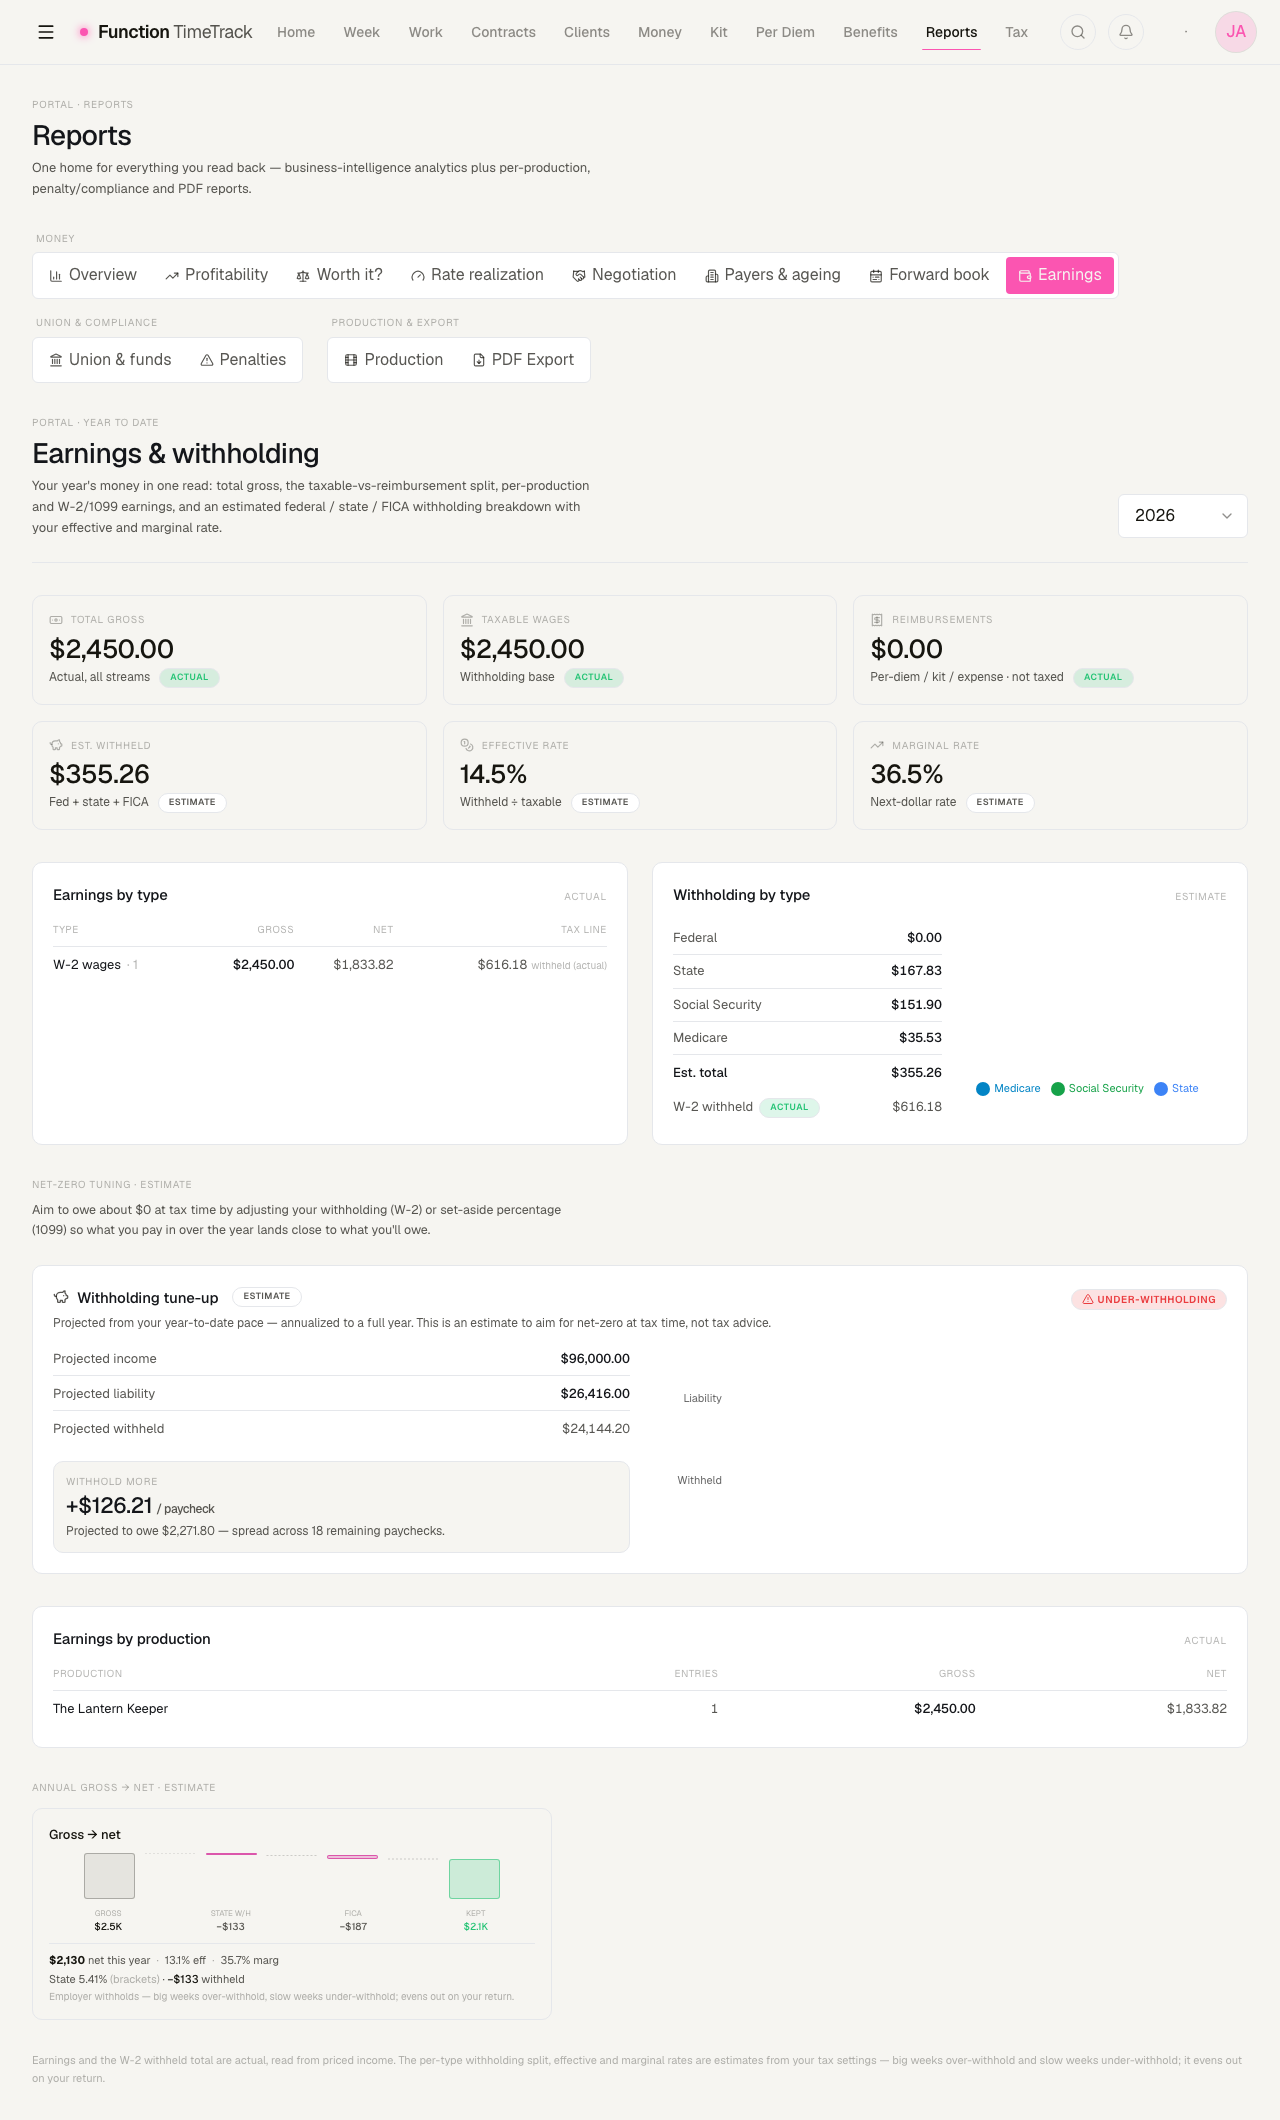
The Earnings tab (labelled "Earnings & withholding") is a year's-money read-back. Pick a year from the selector in the top-right — it offers the current year plus the previous four.
The headline tiles
| Tile | Meaning |
|---|---|
| Total gross | Everything you earned, all streams. |
| Taxable wages | The portion that's subject to withholding. |
| Reimbursements | Per diem, kit fees, and expense reimbursements — money paid to you that isn't taxed. |
| Est. withheld | Estimated federal + state + FICA withholding. |
| Effective rate | Total withheld ÷ taxable wages. |
| Marginal rate | Your next-dollar tax rate. |
Actual vs. estimate — read the badges
Every figure on this tab carries a small badge telling you where it came from:
ACTUAL— read straight from your priced income. Your earnings totals and the W-2 amount actually withheld are real, not recomputed.ESTIMATE— modelled from your tax settings. The per-type withholding split, the effective rate, and the marginal rate are projections.
Withholding here is an estimate
The withholding breakdown is calculated from your tax settings (filing status, state of residence, expected annual income), not from your actual pay stubs. Big weeks over-withhold and slow weeks under-withhold — it evens out on your return. For accuracy, keep your tax settings current. The one exception is W-2 withheld, which is an actual figure read from your income.
The tables and the waterfall
Below the tiles you get:
- Earnings by type — gross, net, and the tax line (W-2 / 1099 / non-taxable) for each classification.
- Earnings by production — the same money broken out per show.
- Withholding by type — a table plus a pie chart of the estimated split.
- Annual gross → net — an honest waterfall from taxable gross down to what you keep, using the same withholding engine as the rest of the app.
No data for a year?
If a year has no priced income yet, the tab shows "No priced income for {year}". Income appears here once your timesheets are priced and income entries are generated for that year.
Production: per-production deep-dive
The Production tab gives you the full, consolidated read-back for a single show across all of its phases.
How to open a production report
- Go to the Production tab.
- Use the picker in the top-right and start typing to search your productions by code or name.
- Select one. Its consolidated report loads below.
Once a production is selected, you get:
- Summary KPIs — total hours, earnings, average daily rate, and active phases.
- Breakdown tabs — By Phase, By Contract, By Rate Tier, and By Payment Source.
- Overtime breakdown — a stacked chart of regular / overtime / doubletime hours, groupable by week, phase, contract, or month.
- Benefits eligibility — progress toward each union's benefit thresholds, with remaining hours and a projected eligibility date.
- Transition timeline — a chronological record of phase, rate-tier, payment-source, and contract changes.
- Filters — a date range and a phase multi-select to narrow the whole report.
Exporting a production report
The production report has its own export buttons offering four formats:
| Format | Best for |
|---|---|
| CSV | Opening in a spreadsheet. |
| Excel | A full .xlsx workbook. |
| JSON | Raw data for a bookkeeper's tools or a developer. |
| The report data as a document. |
Each button shows its own loading spinner and downloads the file automatically when ready.
These are the production report exports
These CSV/Excel/JSON buttons live inside the Production report and export that report's data. The polished, printable financial documents (Annual Earnings, Project Summary, Expense Report) live on the separate PDF Export tab described below.
Union & funds: what went into the funds
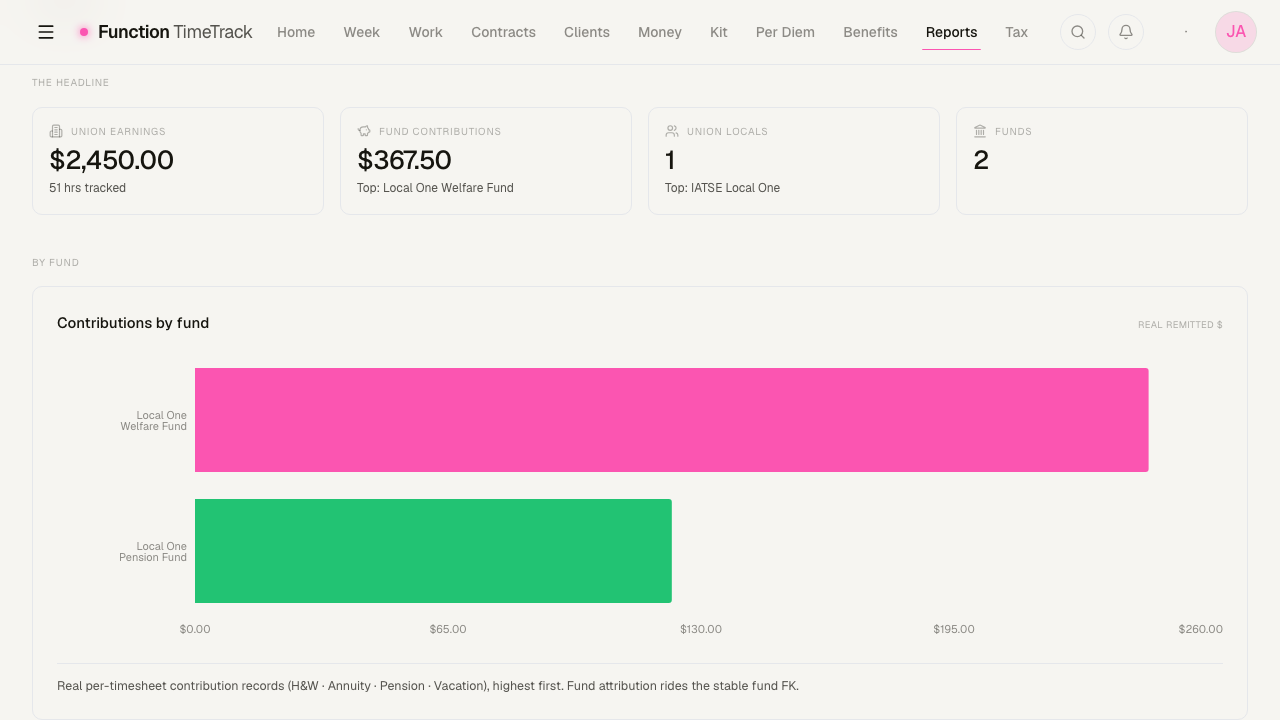
The Union & funds tab is the analytics sibling of the quarterly filing on Benefits. It rolls your earnings, days and real benefit-fund contributions up by Union Local and by fund, so you can track pace toward membership and eligibility thresholds without opening the remittance view.
Four headline tiles give union earnings and hours, total fund contributions, the number of Locals and the number of funds. Below them, Contributions by fund ranks the funds by money remitted, and a card per Local carries its earnings, hours and contributions.
Why a fund can read 'Unattributed fund'
Fund attribution rides the fund id recorded on each week's benefits breakdown, not on the contract's current configuration. A week priced before that id was stored still contributes its money — the total stays right — but it lands in a single Unattributed fund bucket rather than being split by fund. Re-pricing the week attaches the ids and the split appears.
If the totals here and on the quarterly report agree but the fund breakdown does not, this is why.
Penalties: union compliance
The Penalties tab surfaces what your contract's penalty rules actually owe you. It runs the same penalty engine the pay calculation uses — nothing here is guessed.
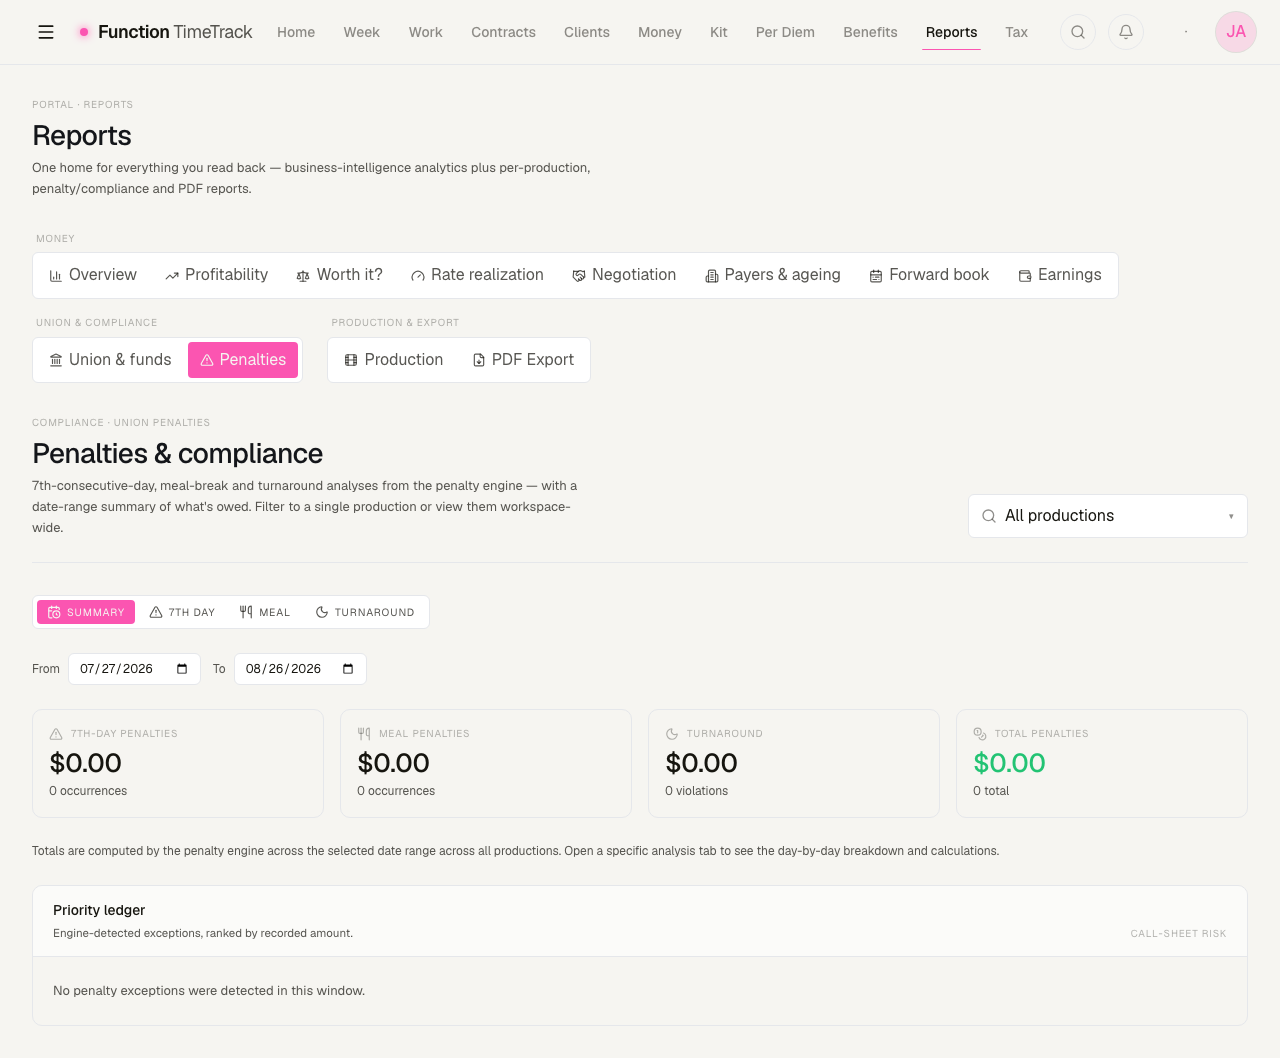
An optional production filter in the top-right narrows every analysis to a single show; leave it on "All productions" to view workspace-wide.
There are four sub-tabs.
Summary — what's owed over a date range
The Summary sub-tab shows four cards — 7th-day, meal, turnaround, and a grand total — for a date range you choose with the From and To pickers (it defaults to the last 30 days). Cards with money owed are highlighted. This is the fastest way to answer "how much in penalties did this show/month generate?"
Below the cards sits a Priority ledger — the engine-detected exceptions in the window, ranked by recorded amount, so the biggest problem is at the top rather than buried in a date list.
7th Day, Meal, and Turnaround — day-by-day analysis
The other three sub-tabs each analyse a single date (use the date navigator to move day by day):
- 7th Day — detects a 7th-consecutive-work-day premium. It shows your consecutive-day streak ending on the chosen date and, when triggered, the double-time penalty and how it was calculated.
- Meal — analyses each work period against the meal-break rules and flags missed meals, with the per-meal penalty calculation.
- Turnaround — compares the rest between the previous shift and the selected day against the minimum turnaround, and shows the violation penalty if rest fell short.
Penalties read from what you logged
These analyses only see recorded work. If a day looks penalty-free but shouldn't, check that the call times, meal breaks, and adjacent shifts are all logged for that date. Navigate to a date at the end of a work stretch to see the 7th-day analysis fire.
PDF Export: formatted documents
The PDF Export tab generates professional, server-rendered PDF documents from your live data. Three documents are available:
| Document | Scope | Contents |
|---|---|---|
| Annual Earnings Summary | A year | Yearly income with monthly and per-project breakdown, W-2/1099 split, union vs. non-union, quarterly totals, and benefit contributions. Built for tax season. |
| Project Summary | One project | Weekly hours, earnings, overtime, per diem, kit fees, expenses, minimum-call adjustments, penalties, and total compensation. |
| Expense Report | A year | Categorized expenses with reimbursement tracking, tax-deductibility, project allocation, and monthly breakdown. |
How to generate a PDF
- Open the PDF Export tab.
- Set the Year in the top-right.
- Optionally choose a production from the picker. It scopes every report on the tab, not just one — leave it on All productions for a workspace-wide document. The Project Summary is the one that requires a production; the other two work with or without.
- Click Generate PDF on the document you want.
- The button shows Generating…, then Downloaded once the file lands. The PDF saves to your browser's downloads.
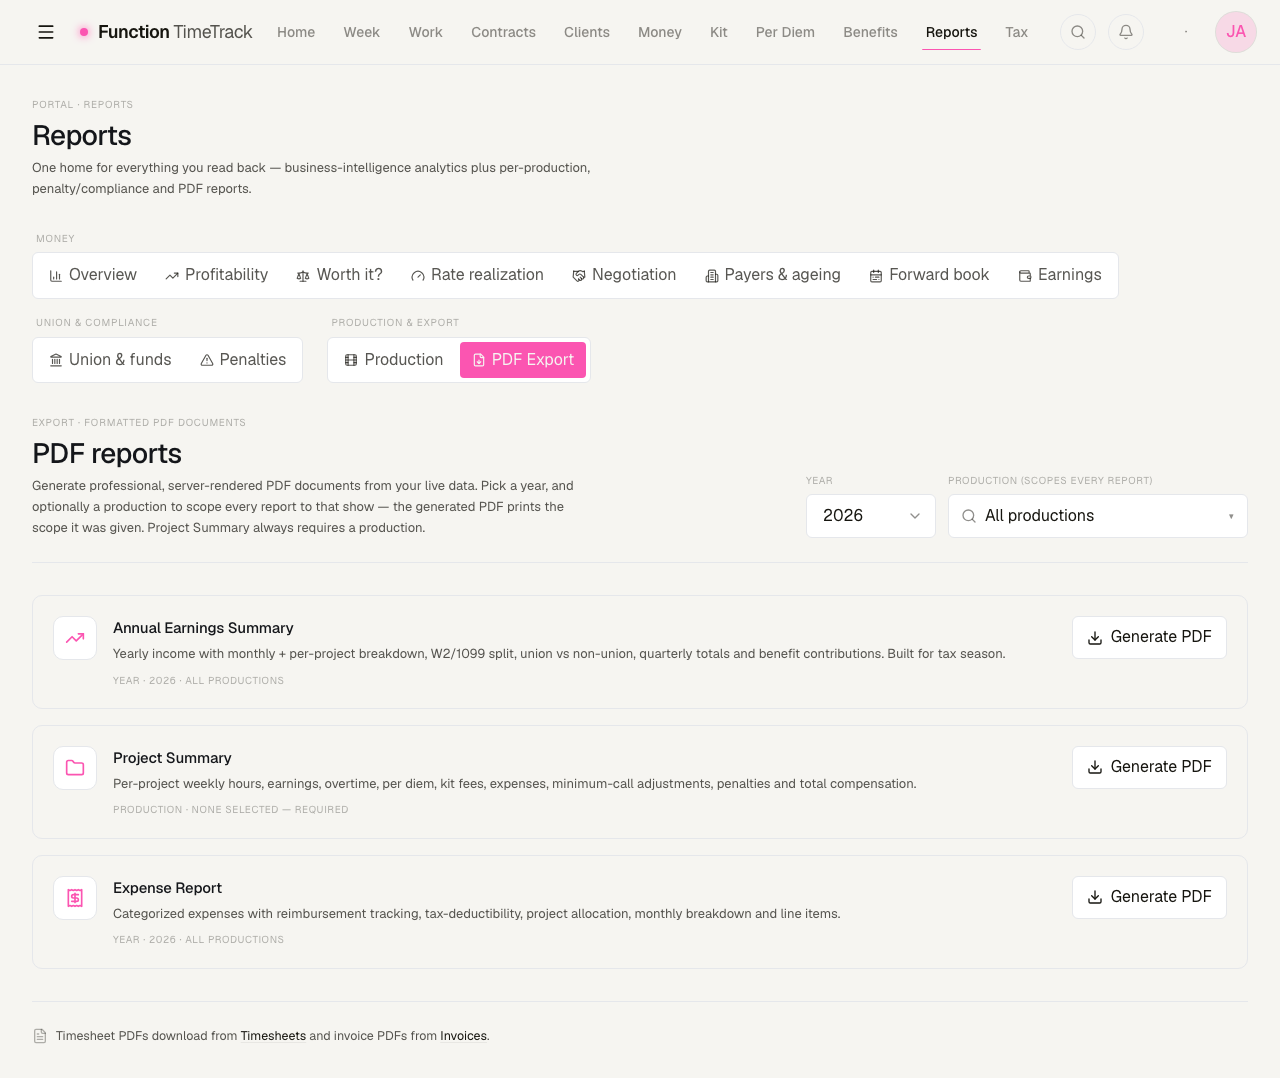
Project Summary needs a production
Each card prints the scope it will be given — "Year · 2026 · All productions", or for the Project Summary "Production · none selected — required". Pick a production and the line updates before you generate anything.
Timesheet PDFs are not generated here — they download from Timesheets, and invoice PDFs from Invoices. The tab says so in its own footnote.
Timesheet and invoice PDFs live elsewhere
This tab covers the three analytical documents above. Individual timesheet PDFs download from the Timesheets page, and invoice PDFs from the Invoices page.
Three old addresses that land here
Reports used to be three separate pages. They were merged into this hub with no capability lost, and the old addresses still work — they redirect, preserving their query string:
| Old page | Now |
|---|---|
/production-reports | /reports?tab=production — the ?projectId= deep link survives the hop |
/penalties | /reports?tab=penalties |
/pdf-reports | /reports?tab=pdf |
Old bookmarks and links keep working; the hub is the address to use from here.
Tips & gotchas
- Reports are read-only. To change a number, fix the source — the week, income entry, expense, or contract — and the report follows.
- Keep tax settings current. The Earnings tab's withholding is only as good as your filing status,
state, and expected-income settings. Everything badged
ESTIMATEdepends on them. ACTUALbeatsESTIMATE. When a figure carries anACTUALbadge it's read from real priced income; treatESTIMATEfigures as planning guidance, not filing figures.- Empty ≠ broken. A "no data yet" card usually means nothing has been logged in that range or year — widen the range or log the work, and it fills in.
- Filter to a production on the Penalties tab (and pick one on Production) to isolate a single show; clear the filter to go workspace-wide.
- Share a deep link. Copy the URL after selecting a tab and production to send someone straight to the exact view.
Clients & payers
Two directories that answer two different questions — who hired you and who you invoice (Customers), and who the money actually comes from (Payment Sources), including how to crosswalk the names a payroll house prints on a cheque stub.
QuickBooks Integration
Connect QuickBooks Online to import customers, push timesheets as invoices, send payment links, and keep payment status in sync automatically.